

First Soil Health map of Latin America and the Caribean
SOHMA supervisor, Professor Dr. Maurício Roberto Cherubin, published the first soil health map of Latin America and the Caribbean in the renowned journal Communications Earth & Environment, part of the Nature Portfolio. The study is the result of a collaboration between researchers from the Department of Soil Science at the Luiz de Queiroz College of Agriculture (ESALQ/USP) and the Center for Carbon Research in Tropical Agriculture (CCARBON/USP) at the University of São Paulo.
According to the researchers, healthy soils are essential to guarantee essential ecosystem services, such as sustainable food production, carbon sequestration, water retention and purification, biodiversity preservation and environmental conservation. However, the data reveal a worrying scenario: 38% of the soils in Latin America and the Caribbean were classified as unhealthy, that is, degraded, while 28% are in moderate condition and only 34% are in good condition to perform their functions. Given these results, experts highlight the urgent need to expand soil conservation and soil health promotion initiatives and programs on a large scale.
Adopting sustainable practices can help reverse degradation, increase the resilience of agricultural ecosystems, and strengthen food security in the region. The study represents a milestone for soil science and provides an important basis for the development of public policies aimed at environmental conservation and the sustainability of agricultural production.
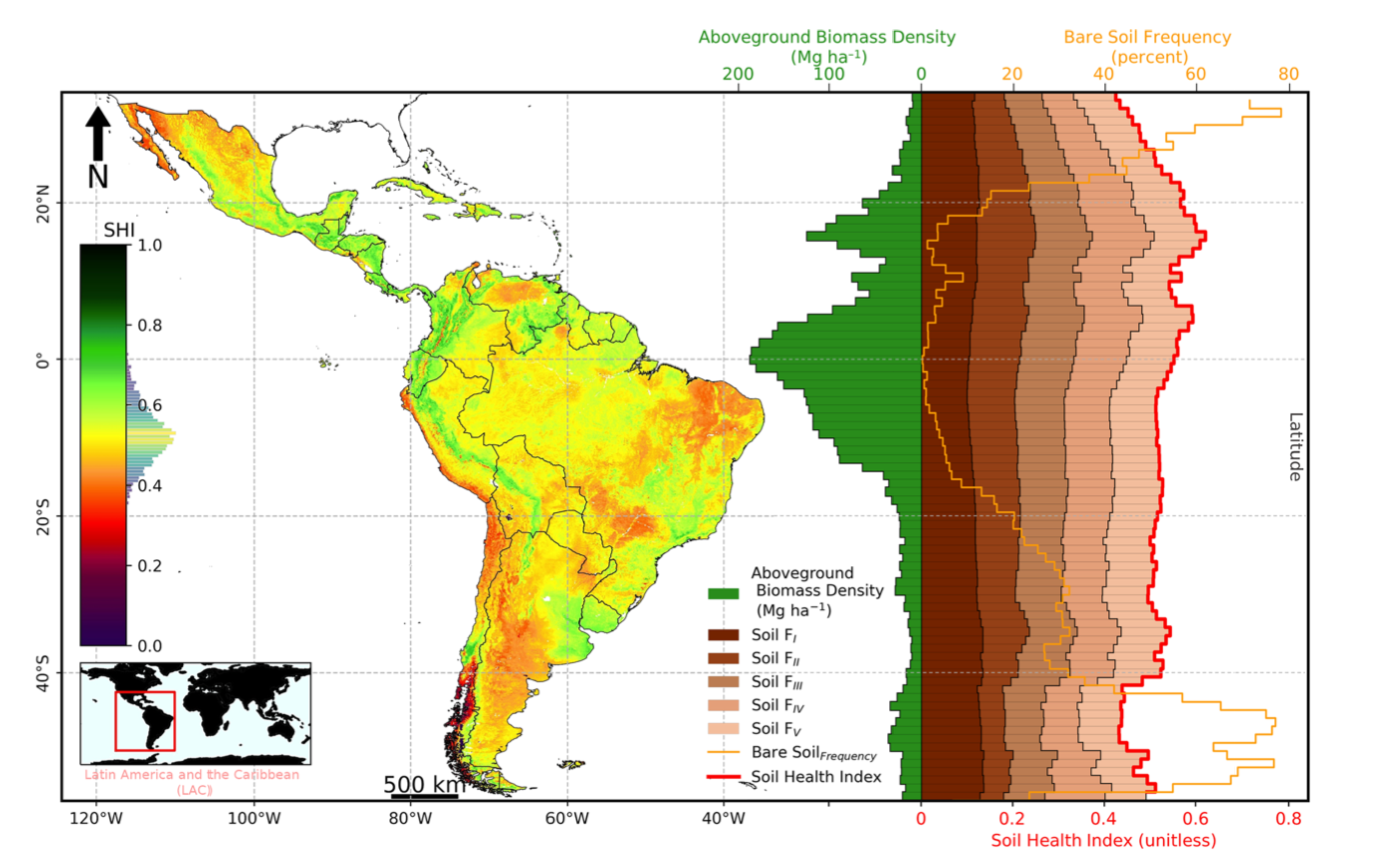
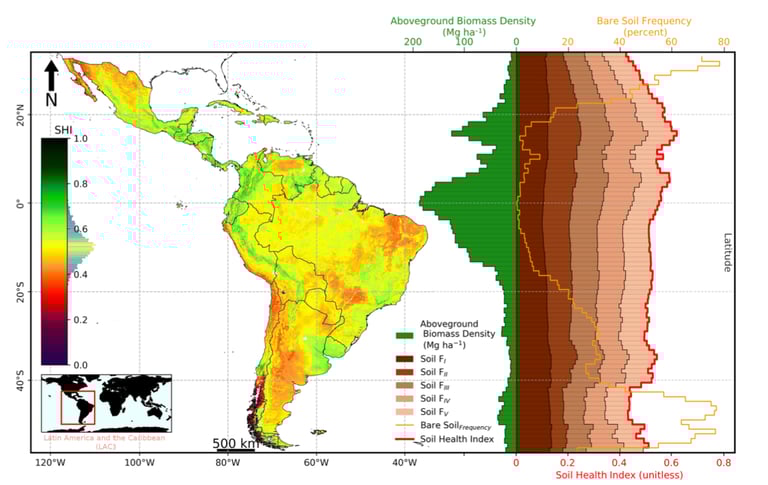
Soil Health Index map for Latin America and the Caribbean. Right side shows latitudinal trends by degree in soil functions, frequency of bare soil 26 and aboveground biomass 41 in LAC. Soil functions: FI – Store, regulate fluxes and availability of chemical elements; FII – Regulate water fluxes, water storage and availability; FIII – Sequester soil organic carbon and support soil biodiversity; FIV – Physical support for plant growth; FV – Resistance to erosion degradation.
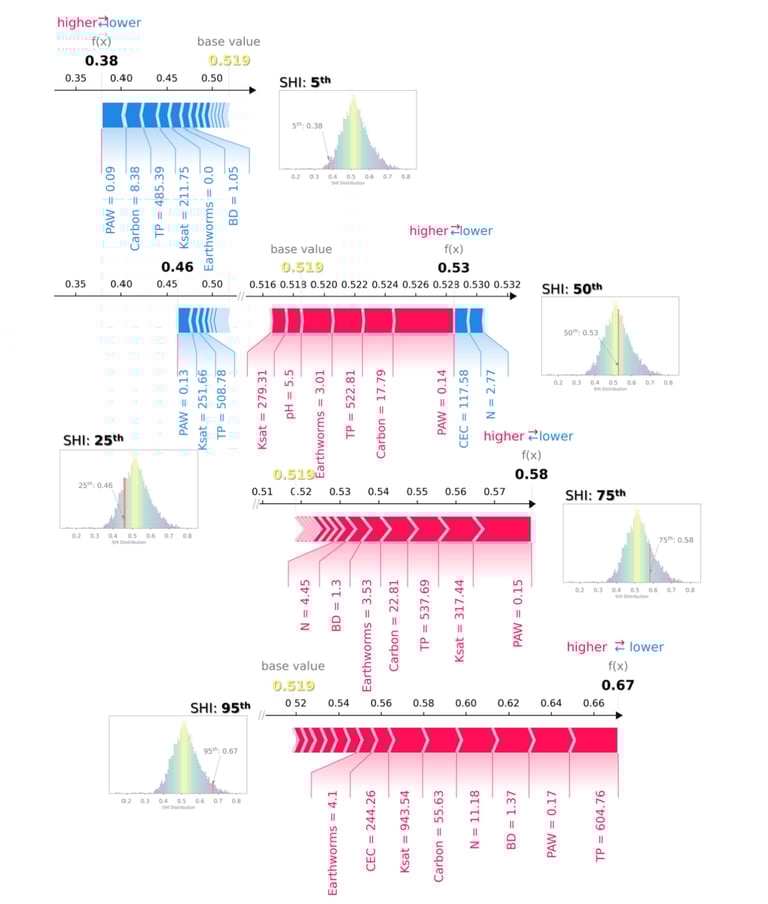
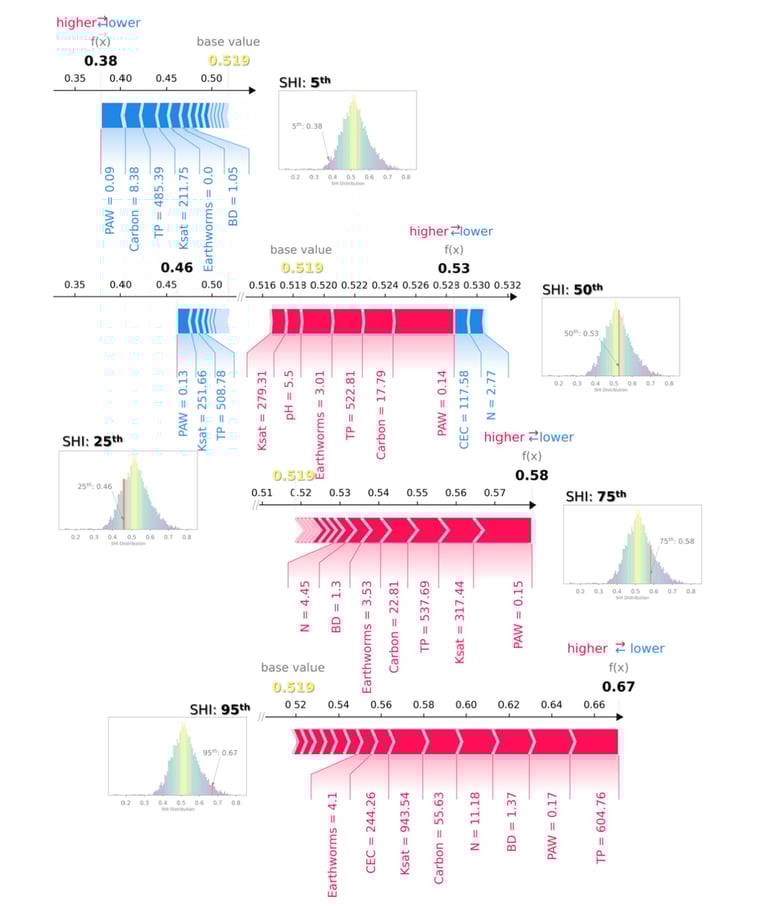
Intrinsic drivers of the Soil Health Index (SHI) in Latin America and the Caribbean. The power plots illustrate the combined impact of each soil indicator on SHI values, with positive effects represented in red and negative implications in blue. These indicators “compete” with each other, resulting in variations in SHI values (grouped in percentiles) relative to the expected SHI baseline value, which is the average prediction for the entire data set (0.519 in this analysis).